On this page
Roughly 60% of Kubernetes production incidents are caused by networking or DNS failures. Examples include NetworkPolicy blocking traffic, CoreDNS being OOMKilled, or a service selector becoming misaligned after a deployment rename. While the Kubernetes API contains the necessary diagnostic data, correlating it quickly under pressure remains a challenge.
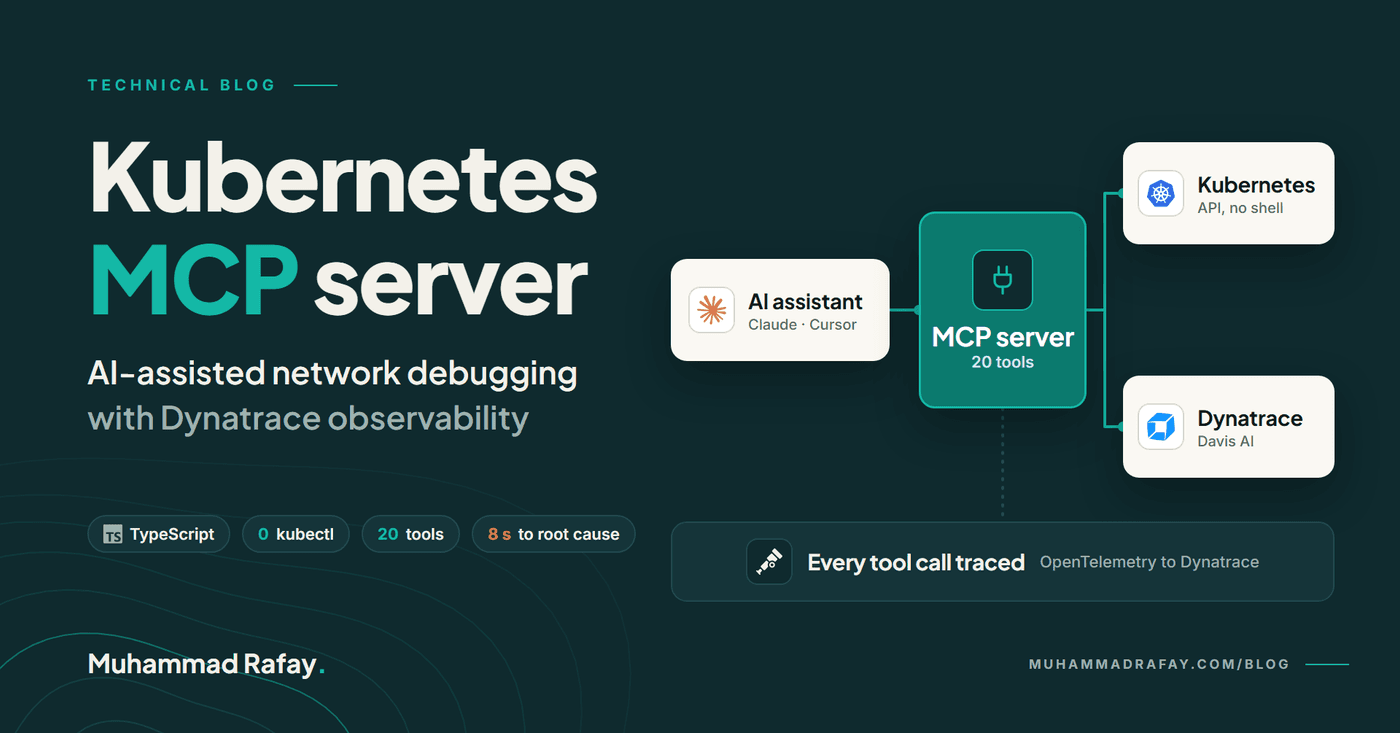
I developed an MCP server that gives AI assistants direct access to Kubernetes and Dynatrace, cutting correlation time from minutes to seconds. Listed on Awesome MCP Servers.
What Is MCP
Model Context Protocol is an open standard from Anthropic that acts as a universal connector for AI tools, similar to USB-C. Previously, each AI integration required custom code for each model and client. MCP standardizes the handshake, enabling a single server to support Claude Desktop, Claude Code, Cursor, and other compatible clients.
Instead of manually copying kubectl output into a chat window, the AI interacts directly with your tools and analyzes live data. You ask a question, and the AI investigates in real time.
User: "Why is my checkout service timing out?"
Claude calls check_service_endpoints, finds no ready endpoints.
Claude calls trace_service_to_pods, finds selector mismatch.
Claude: "The checkout service has no ready endpoints because the pod selector does not match. Here is the fix."
Total resolution time: 8 seconds.
Architecture
The server includes 20 tools across three core areas, all integrated with a non-invasive OpenTelemetry middleware layer:
- Kubernetes management (7 tools): pods, logs, deployments, events, namespace health scores
- Network debugging (10 tools): NetworkPolicy analysis, DNS debugging, service path tracing, Ingress validation, orphaned service detection, node network status, service mesh inspection
- Dynatrace correlation (3 tools): Davis AI problems, entity health metrics, alert-to-event correlation
Each tool invocation generates an OpenTelemetry trace, an invocation counter, and a latency measurement, all sent automatically to Dynatrace. The tool implementations contain no telemetry code.
Why No kubectl
Most Kubernetes tools rely on shelling out to kubectl, which introduces shell injection risks. For example, a pod name such as production-pod; rm -rf / can become a threat vector if interpolated into a shell command.
This server uses @kubernetes/client-node exclusively, so it makes direct, TLS-authenticated API calls without relying on a shell. TypeScript enforces argument types at compile time, and API calls execute in parallel:
1const [podsRes, eventsRes] = await Promise.all([2 coreV1Api.listNamespacedPod(namespace),3 coreV1Api.listNamespacedEvent(namespace, undefined,4 undefined, undefined, 'type=Warning'),5]);
The overall response time is determined by the slowest call, rather than the sum of all calls.
The Non-Invasive Telemetry Pattern
Observability is essential for every tool, but embedding telemetry code within each tool increases coupling and maintenance overhead. Instead, I applied the decorator pattern.
One function wraps every tool:
1export function withTelemetry(toolName, handler) {2 return async (args) => {3 return tracer.startActiveSpan(`mcp.tool.${toolName}`, async (span) => {4 invocationCounter.add(1, { tool: toolName });5 try {6 const result = await handler(args);7 span.setStatus({ code: SpanStatusCode.OK });8 return result;9 } catch (err) {10 errorCounter.add(1, { tool: toolName });11 span.setStatus({ code: SpanStatusCode.ERROR });12 throw err;13 } finally { span.end(); }14 });15 };16}
In index.ts, every tool registration is one line:
1handler: withTelemetry('list_pods', listPods),
Tool files contain only business logic, with no telemetry code, making them fully testable in isolation.
Network Debugging: The Core Value
analyze_network_policy: Identifies all NetworkPolicies applicable to a specific pod and detects default-deny policies (empty podSelector with empty ingress array), which are a common cause of silent connection failures after namespace hardening. This single call replaces manual label matching across multiple policies.
trace_service_to_pods: Traces the complete path from service selector to EndpointSlices, Pods, and NetworkPolicies, identifying precisely where the chain breaks. This replaces multiple kubectl commands and manual correlation.
debug_dns_config: Reads the CoreDNS plugin list from the ConfigMap and inspects a pod's DNS policy. A pod with dnsPolicy: None and no dnsConfig is considered to have broken DNS. This issue is detected in a single call without DNS-level testing.
find_orphaned_services: Identifies services whose selectors do not match any running pods, detecting deployment renames where the service was not updated. This is a common cause of silent traffic failures after a rename.
Dynatrace Integration
Dynatrace is the preferred backend for three reasons. It natively accepts OpenTelemetry via /api/v2/otlp without requiring a Collector. Davis AI automatically correlates anomalies across traces, metrics, and logs into unified problems.
Additionally, the entities accessed by the MCP server (services, pods, deployments) are often already monitored in Dynatrace, enabling cross-linking from tool traces to the entity's full observability view.
The three Dynatrace tools close the loop between Kubernetes state and business impact:
get_dynatrace_problems: queries Davis AI problems filtered by namespace. After spotting K8s issues, the AI can immediately check whether Dynatrace has already correlated them into a problem with an identified root cause.correlate_alerts_with_k8s: combines Dynatrace problems with Kubernetes-specific event types (node unavailable, pod eviction, unschedulable) in a time window. Answers "did the evictions precede or follow the service degradation?"get_entity_health: pulls P50 response time and error rate for any monitored service from Dynatrace's built-in metrics.
What You See in Dynatrace
Each tool call generates a distributed trace named mcp.tool.{toolName}, including duration, success status, and error details. Logs include trace IDs, allowing direct navigation from a log entry to the full trace for that request.
The system automatically collects three metrics: invocations per tool, errors per tool, and latency histograms per tool. Dashboards show the most-used tools, P95 latency per tool, and error-rate spikes that may indicate RBAC changes or connectivity issues before they affect users.
Getting Started
1git clone https://github.com/mrafay7655/kubernetes-observability-mcp-server.git2cd kubernetes-observability-mcp-server3npm install && cp .env.example .env4npm run build
Add to Claude Desktop config:
1{2 "mcpServers": {3 "kubernetes-observability": {4 "command": "node",5 "args": ["/path/to/dist/index.js"],6 "env": {7 "DT_ENV_URL": "https://YOUR_ENV.live.dynatrace.com",8 "DT_API_TOKEN": "dt0c01.YOUR_TOKEN"9 }10 }11 }12}
Restart Claude Desktop and ask: "List pods in the default namespace." The AI will query the cluster directly.
Conclusion
Kubernetes incidents are challenging not because the data is hidden, but because it lives in multiple places and must be manually correlated under pressure. MCP removes this bottleneck. The AI handles correlation, so you can focus on resolving the issue.
This server implements that concept for Kubernetes and Dynatrace. The patterns of native API access, the withTelemetry() decorator, and self-monitoring via OpenTelemetry apply to any domain where an AI assistant could benefit from direct access to live operational data.
The code is open source at github.com/mrafay7655/kubernetes-observability-mcp-server. If you run Kubernetes in production, consider trying it. If a tool is missing, please open an issue. Also listed on Awesome MCP Servers.
About the Author
Muhammad Rafay is a cloud and DevOps consultant for government and enterprise teams, specializing in Kubernetes, OpenShift, and AI platform infrastructure on Azure, AWS, and Google Cloud. He works remotely with teams across the UAE, Saudi Arabia, and the wider GCC.
- Website: muhammadrafay.com
- Blog: muhammadrafay.com/blog
- Medium: medium.com/@muhammadrafay7655
- LinkedIn: linkedin.com/in/rafay7655
- X: x.com/MRafay765
- Book a 30-minute call: calendly.com/muhammadrafay7655/30min
Related
All insightsOpenshift
OpenShift Pod Stuck in Pending: How to Debug Taints, Tolerations, Affinity and Topology Spread
A Pod stays Pending when no node passes every required rule, and often no single rule is wrong. How the scheduler filters nodes, what taints, affinity and topology spread each guarantee, a worked example where correct rules combine badly, and a six-step workflow to find the blocking rule.
Openshift
OpenShift Networking Deep Dive: OVN-Kubernetes Architecture and Traffic Flow
Follow one request through an OpenShift cluster: how OVN-Kubernetes turns Kubernetes objects into a logical network, how OVS and Geneve move the packets, where Services, NetworkPolicy, the router and egress fit, and how to trace a failing connection layer by layer.